


June 2, 2022 •Array Team
When you are looking to improve your events, or even turn a series of one-off events into a more strategic event program, the first place you'll likely look is at the results of previous events. But what form those results take and how useful they are is dependent on whether you are looking at unstructured information or something that has already been analyzed for patterns and meaning.
This is where some important terminology comes into play. Data, metrics, reporting, analytics, and insights are frequently used interchangeably, but they each have a specific meaning. Making the distinction between them can mean the difference between analysis paralysis – a state of stagnation caused by too much raw information – and the evolution of your events into strategic tactics that generate business opportunities.
If you think of it like a puzzle, the hundreds or thousands of individual data points are the puzzle pieces, and only once you put them together in the right way are you able to see the full picture – and the insights within. By understanding the difference between data, metrics, reporting, analytics, and insights, you are taking the first step in being able to put the puzzle together.
🧩 Data: collected information, ranging from demographics to engagement during the event
Collecting data from your audience is a fundamental part of every event, whether it is an intentional process or not. But what is data, and how can you make it useful? Data is collected information, ranging from the most basic action to complex engagement. Data is generated when someone interacts with anything on a webpage, such as a button click or typing in a message. The time that the action happens, who took the action, and more are also data points. At this stage, the data is uncategorized and only forms the foundation for further analysis. Often, this data is collected, stored in a spreadsheet that is disorganized or difficult to parse, and inevitably forgotten about.
So why bother collecting data at all? Data collection is the first piece of the puzzle of improving your event and meeting strategies. It serves as the basis for all of the other steps in this process. Raw data doesn’t mean much, but there are ways of measuring this data against goals, which is where the second piece of the event strategy puzzle comes in: metrics.
🧩 Metric: a piece of collected data that helps measure against a stated goal
Metrics and data are similar but with an important distinction: while data can sometimes be random pieces of information that have no use, metrics are data that are measured against a stated goal. There are goals for every event. Otherwise why would they happen? The goals could be about attendance, revenue generation, knowledge transfer, feedback collection, alignment or any number of things. Metrics refer only to the data that helps measure against those goals. In other words, turning data into metrics is a way to separate the useful information that you gather from your events from the noise.
Going into your event with the end goals in mind (i.e. the percentage of audience engagement you would like to achieve or the percentage of knowledge transfer required for your session) automatically gives you a starting point for improving your events. Since metrics tell you exactly how close to or far away from your goals the event or meeting ended up being, it is simple to start to create an updated strategy for future plans.
But even if you are only collecting the most relevant data to measure against your goals, metrics are still unstructured and can make the average event organizer or business owner's eyes glaze over. Reporting, the third piece of the puzzle, can make metrics more easily digestible.
🧩 Reporting: an organized collection of data and metrics
Reporting is a way to organize and communicate the data and metrics you collect. Reporting can take the form of a spreadsheet organized into columns and rows with headers and ways to filter the data, or it can be presented visually with graphs and charts. However, not all reporting is created equal. If the reporting is difficult to read or doesn’t contain the context of the goals for the meeting, the odds of you being able to gain any actionable insights from it are slim.
If the reporting is organized well and reflects how far you are from the goals you set, the patterns should be more easily identifiable which leads you to the fourth piece of the puzzle, analytics.
🧩 Analytics: a summary of patterns within collected metrics
The term analytics refers to patterns that are identified within collected data and metrics. This requires digging into the reporting and revealing aggregate information, comparisons between data, benchmarking, and other analyses. In order to reference the right combination of metrics to analyze requires an understanding of what the end result should look like.
For example, metrics can reveal what content produced the most engagement interactions, but if a goal of the meeting is to understand whether a gap in knowledge has been corrected, then only once those interactions have been filtered by HCP type can you start to reveal opportunities to address and refine that content. Adding metrics on which speakers were most effective and comparing to correct answer scores on the topics would indicate potential opportunities for speaking training, too.
There are even technologies that can parse data sets and reveal patterns and analytics. But the next step, translating analytics into actionable insights, requires a more human touch.
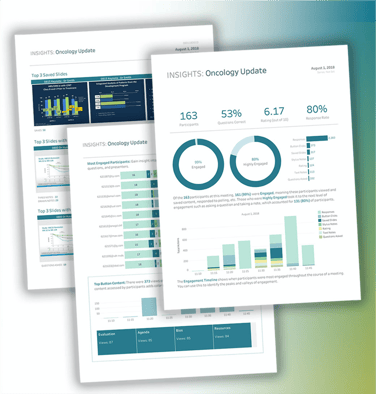
🧩 Insights: thought-provoking outcomes that lead to possible new courses of action
Insights take the data a step further than analysis by answering the question, "so what?" or “why is this important to my business?”
Knowing that 90% of people answered a polling question correctly is useful, but an insight might tell you that you need to restructure part of a presentation because those 10% that got it wrong all made the same mistake, indicating that something they saw or heard caused the confusion. If confidence levels in answering that question have been measured, then analysis may indicate a group of participants who were most confident but when answering incorrectly, and have likely been misinformed. The action to take therefore would be to assess who falls into this category and address that potential misinformation directly, or en masse if appropriate.
With insights come action. If your analysis of the data doesn't prompt you to take steps to progress and/or improve, then it's not doing you any good.
Insights come from pulling actionable steps out of the analytics of your event data. Actionable steps are things that can be used to immediately improve your events, such as finding a knowledge gap based on polling responses that you can then pay extra attention to at a future session or point out in a follow-up. You might also obtain insights into information about how well you achieved your event goals, how engaged your audience was throughout your event, your participant demographics and what that means for your event, audience satisfaction and evaluation, and more. Insights are the best way to take your events to the next level since they provide you with immediately concrete and implementable steps that can improve event experiences for you and your attendees.
So what happens when you pull all of these pieces together?
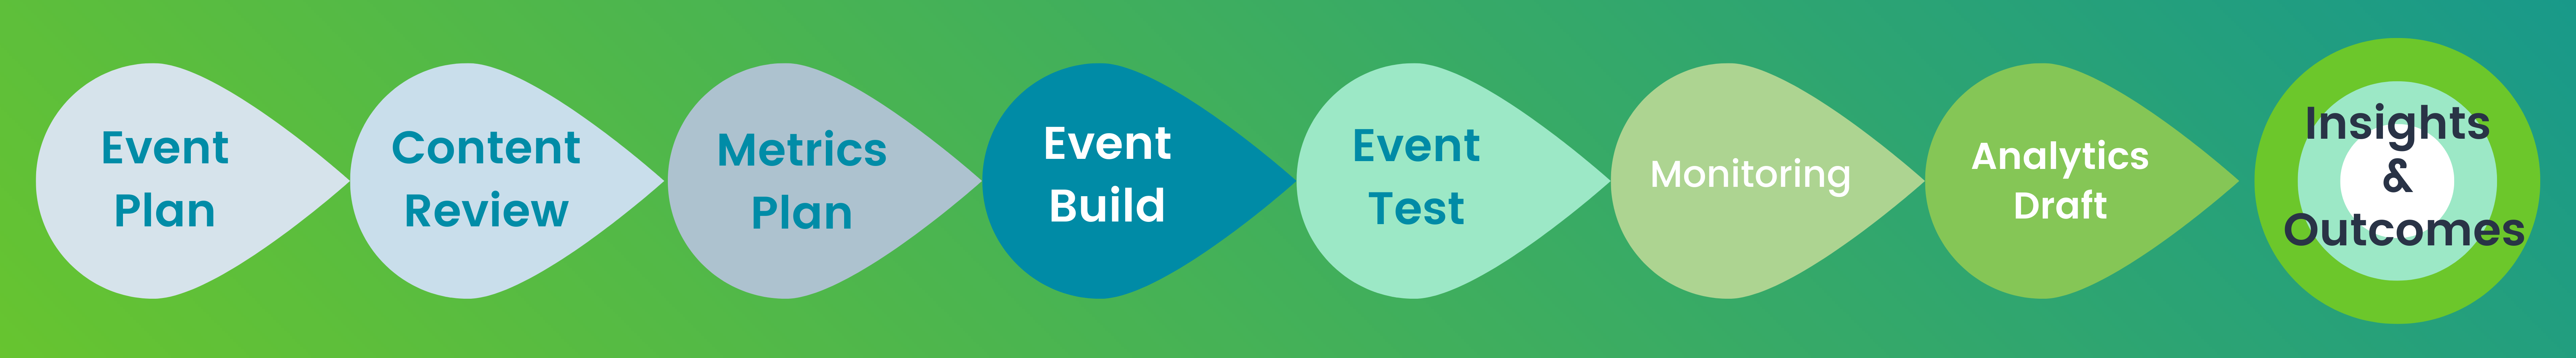
All of these pieces (Data, Metrics, Reporting, Analytics, and Insights) pulled together create a complete event and meeting strategy puzzle that we call the Event Lifecycle, as pictured above. With Array's Analytics & Insights Management (AIM) team, we are your partner from the beginning of the process where we help you set your event goals to the end where we pull out actionable insights from your data and give you recommendations to improve future events.