


February 18, 2022 •Array Team
Research has shown that audience engagement is correlated with learning. But how effective is technology at engaging audiences and improving learning? ArrayTM is a proprietary technology designed to increase engagement at in-person, virtual and hybrid events by providing ongoing, multi-faceted, and interactive opportunities for content engagement. To determine whether engagement via Array had an impact on audience knowledge, we conducted data analyses comparing high engagers and low engagers on the percentage change in knowledge of the meeting content measured before and after a series of life sciences educational events. Statistically significant results showed that meeting participants who were high engagers with Array had a nearly 20% improvement in knowledge compared to low engagers. These findings support our experience at over 10,000 life sciences events that engagement with Array influences learning and highlights the value in utilizing the technology to engage audiences and improve knowledge transfer.
It is broadly accepted that higher levels of engagement lead to better outcomes. This has been observed in various settings, from business (Sorenson, 2013) to the classroom (Casuso-Holgado et al., 2013; Dyer, 2015; Williams & Whiting, 2016), and is one of the primary goals of life sciences professionals: Increase engagement of their attendees with the expectation of better outcomes.
While there are many ways to engage participants in live meetings (e.g., compelling content, immersive instructional design, dynamic presenters/moderators), the increasing availability and use of technology in events has become a primary instrument by which organizers and instructors seek to engage their learners. But how effective is technology, such as Array, in engaging learners with the content being presented at life sciences events? And can engagement in this manner be a predictor in the desired outcomes?
We sought to answer these questions by conducting analyses comparing high engagers and low engagers of Array on the percentage change in knowledge of the content presented. This report reviews findings from the analysis of data from a series of live life sciences events that engaged audiences using Array. Our goal was to demonstrate the value in measuring content engagement with Array.
The broad definition of engagement refers to the degree of attention, curiosity, interest, optimism, and passion that learners show when they are learning or being taught (Great Schools Partnership, 2016). Content engagement in context of this study is equating the traits above with interaction with content being presented within an engagement technology platform, i.e., Array, during a live meeting. Audience interactions included asking questions, taking notes, accessing/saving content, responding to polls, etc.
For this study, we obtained data from two in-person events, which included multiple questions assessing knowledge of the educational material.
Data from 832 participants from the two in-person events were included in the analysis. Pre- and post-test knowledge scores for each participant were represented as percentages in the dataset, reflecting the percentage correct across several knowledge questions, for each time point (i.e., pre- or post-event). Engagement was based on polling response rate, which is a percentage reflecting the number of polling questions answered by each participant divided by the total number of polling questions, multiplied by 100.
Two variables were defined in the analysis.
An analysis of variance (ANOVA) was conducted, specifying percentage change in knowledge from pre- to post-test as the response variable and engager level as the classification variable.
In addition, we collected data reflecting various forms of content engagement via Array, including the number of slides saved, notes taken, questions asked, questions answered, button clicks, and slide ratings. An aggregate “total actions” variable was also calculated.
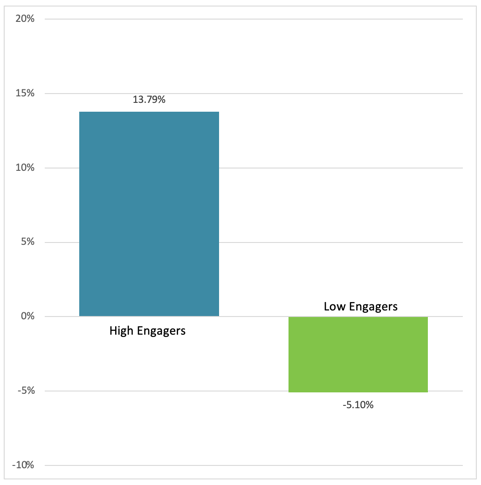
Findings from the ANOVA showed a statistically significant difference on percentage change in knowledge between high (n = 682) and low engagers (n = 150). Specifically, high engagers demonstrated at 13.79% increase in knowledge following the medical meetings, whereas low engagers showed a reduction in knowledge of 5.1%, leading to an 18.89% difference between the two groups. Figure 1 shows the percentage changes in knowledge scores for the high and low engagers.
Figure 1. Change in Knowledge Scores for High and Low Engagers
These findings demonstrate the difference in learning outcomes between highly engaged participants and those with low engagement, highlighting the utility of interactive technology, and the importance of measuring engagement and incorporating engagement metrics into analysis and reporting. By increasing the engagement level of audiences with technology like Array, life sciences event stakeholders can help individual participants better learn material and significantly improve the overall impact of their events on knowledge transfer. We hope our results will encourage life sciences event stakeholders to not only develop ways to further engage their audiences, but also measure various types of engagement and make engagement an integral component of their events and business outcomes reporting.
Casuso-Holgado MJ, Cuesta-Vargas AI, Moreno-Morales N, Labajos-Manzanares MT, Baron-Lopez J, Vega-Cuesta M. The association between academic engagement and achievement in health sciences students. BMC Med Educ. 2013;13:33. Published online February 27, 2013. doi: 10.1186/1472-6920-13-33. Available at: https://www.ncbi.nlm.nih.gov/pmc/articles/PMC3599896/. Accessed April 26, 2018.
Dyer K. Research Proof Points – Better Student Engagement Improves Student Learning. Teach. Learn. Grow. Published online September 17, 2015. Available at: https://www.nwea.org/blog/2015/research-proof-points-better-student-engagement-improves-student-learning/. Accessed April 26, 2018.
Great Schools Partnership. Student Engagement: The Glossary of Education Reform. Published online February 18, 2016. Available at: https://www.edglossary.org/student-engagement/. Accessed April 26, 2018.
Kass GV. An exploratory technique for investigating large quantities of categorical data. Applied Statistics. 1980;29(2):119-127.
Sorenson S. How Employee Engagement Drives Growth. Business Journal. Published online June 20, 2013. Available at: http://news.gallup.com/businessjournal/163130/employee-engagement-drives-growth.aspx. Accessed April 26, 2018.
Williams D, Whiting A. Exploring the Relationship Between Student Engagement, Twitter, and a Learning Management System: A Study of Undergraduate Marketing Students. International Journal of Teaching and Learning in Higher Education. 2016;28(3):302-313. Available at: https://files.eric.ed.gov/fulltext/EJ1125099.pdf. Accessed April 26, 2018.